GIS

G-I-Yes! Musings Among two Geographers on GIS Day

by Erica Simek Sloniker, GIS and Visual Communications and Jamie Robertson, Spatial Analyst

What low laying areas in this valley will flood during the next big storm? How many acres of Cascade forests need to be restored in order to prevent big, catastrophic wildfires? Where are the best elk migration corridors in our state?

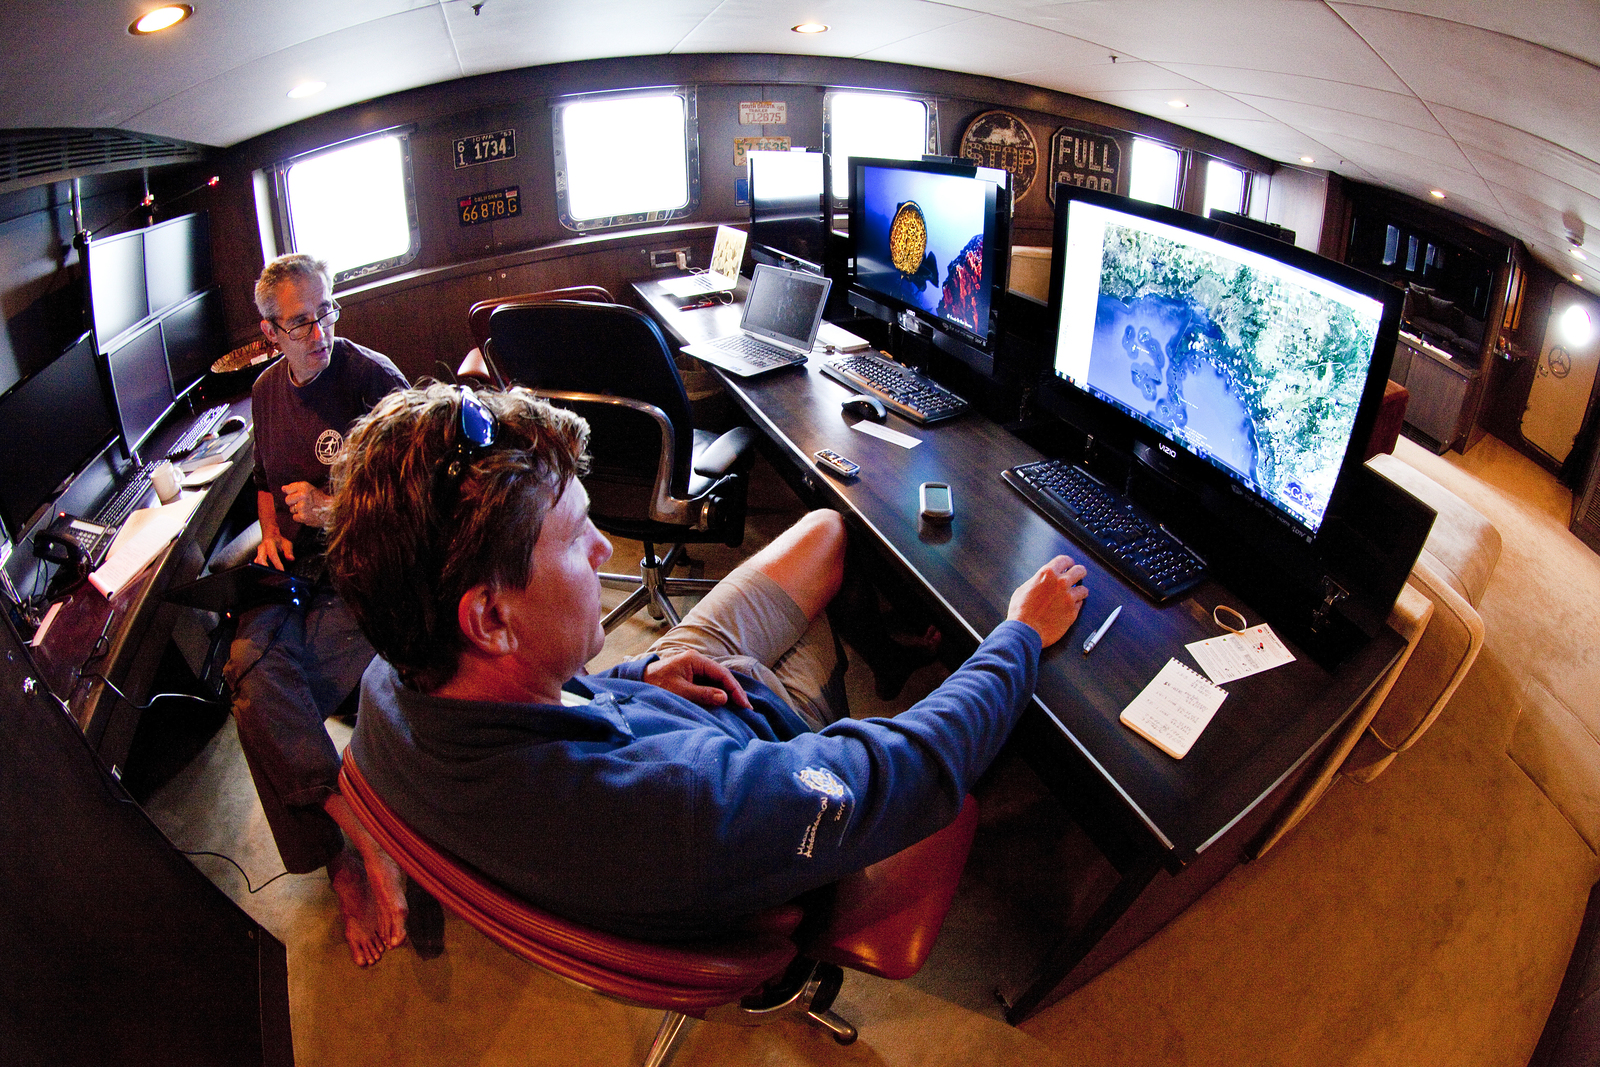
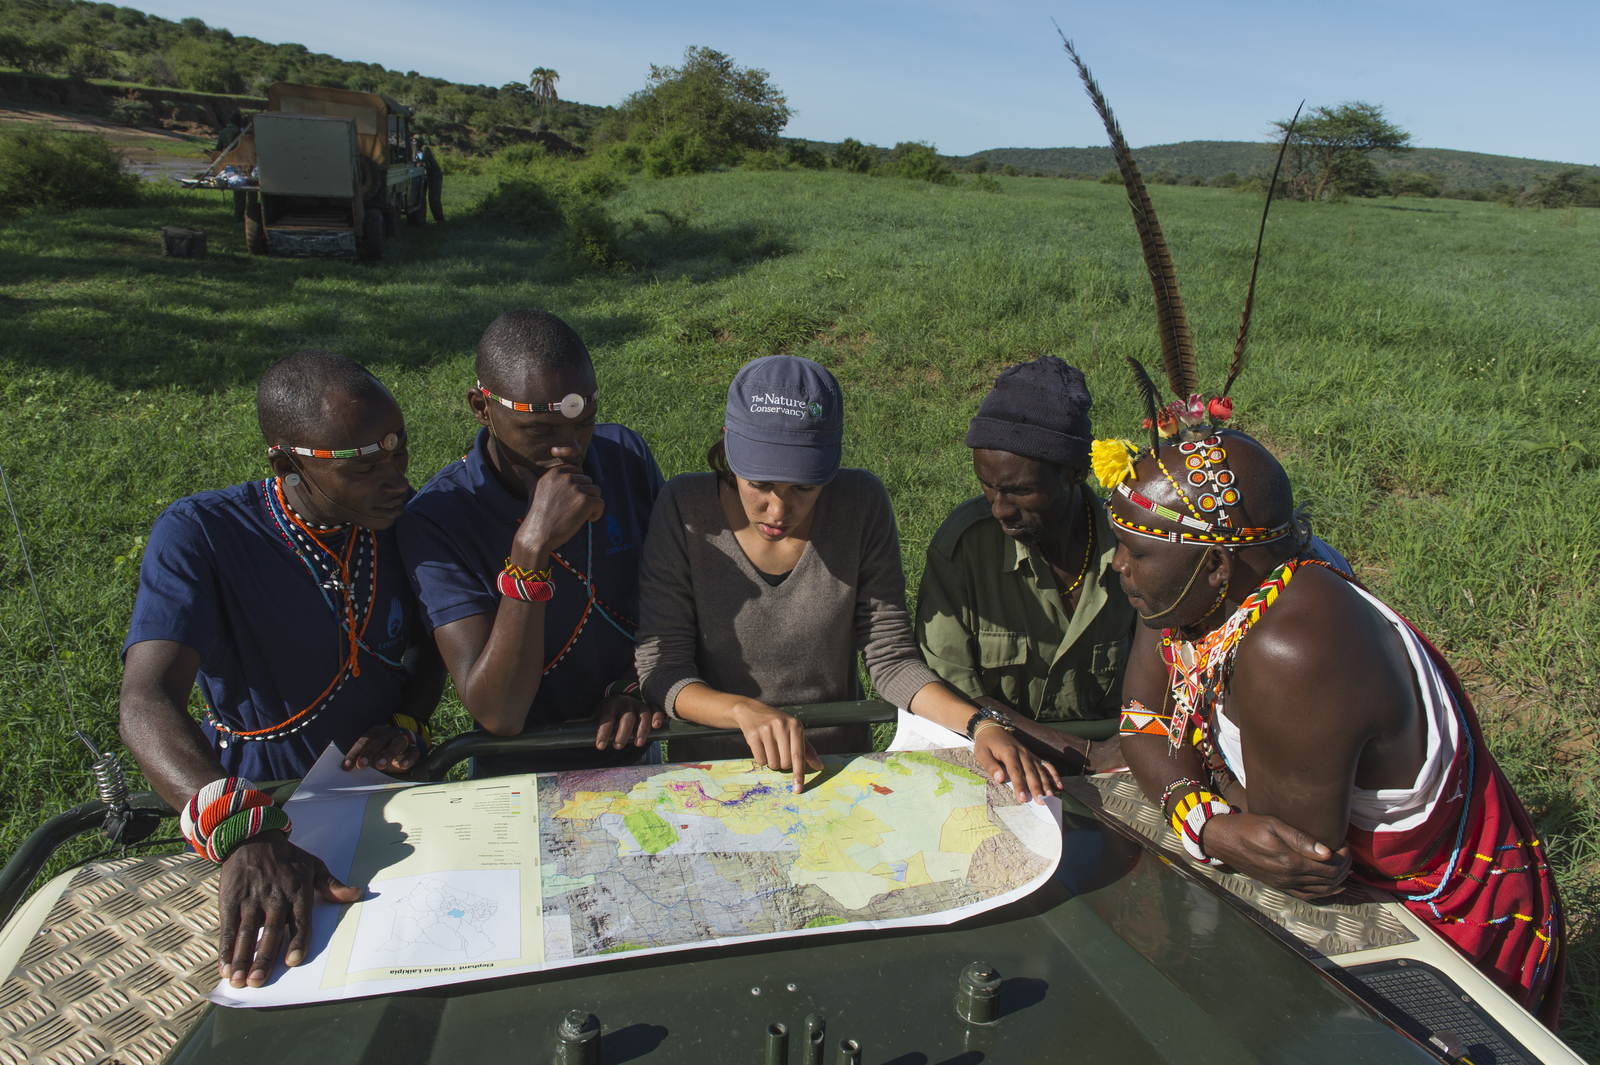
These questions, and many more, can be answered using geographic informative systems (GIS). GIS is a computer system capable of holding and using data describing places on earth’s surface. It is a powerful tool that allows us to look at the relationships of features on the landscape. With that knowledge, we can make informed decisions about the places and things we care about. Cool! Companies like Google and Microsoft have harnessed the power of GIS in tools like Google Earth, Google Maps, and Bing Maps. Federal and state agencies use GIS to catalog and analyze information from natural resources to census track data. And non-profits, like The Nature Conservancy, use GIS to help solve the toughest environmental questions of the day.

In celebration of GIS Day, November 16th, a day that celebrates the real-world applications of GIS that are making a difference in our society, two GIS professionals from our office sat down for a question and answer session to talk maps and data and to share geography stories. They invite us all to become map lovers!


Q: What is a favorite GIS project you’ve worked on recently?

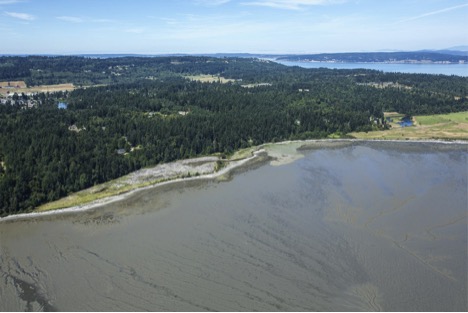
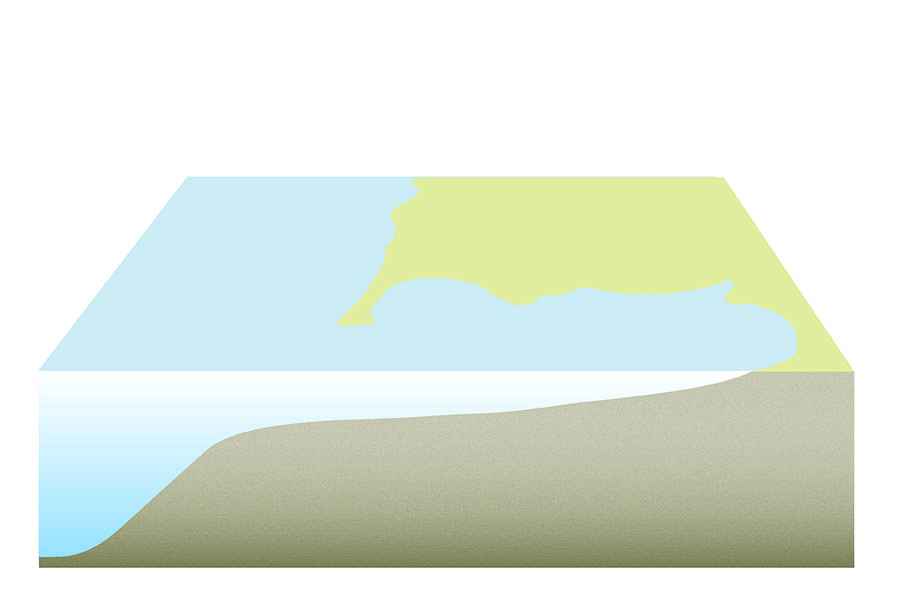
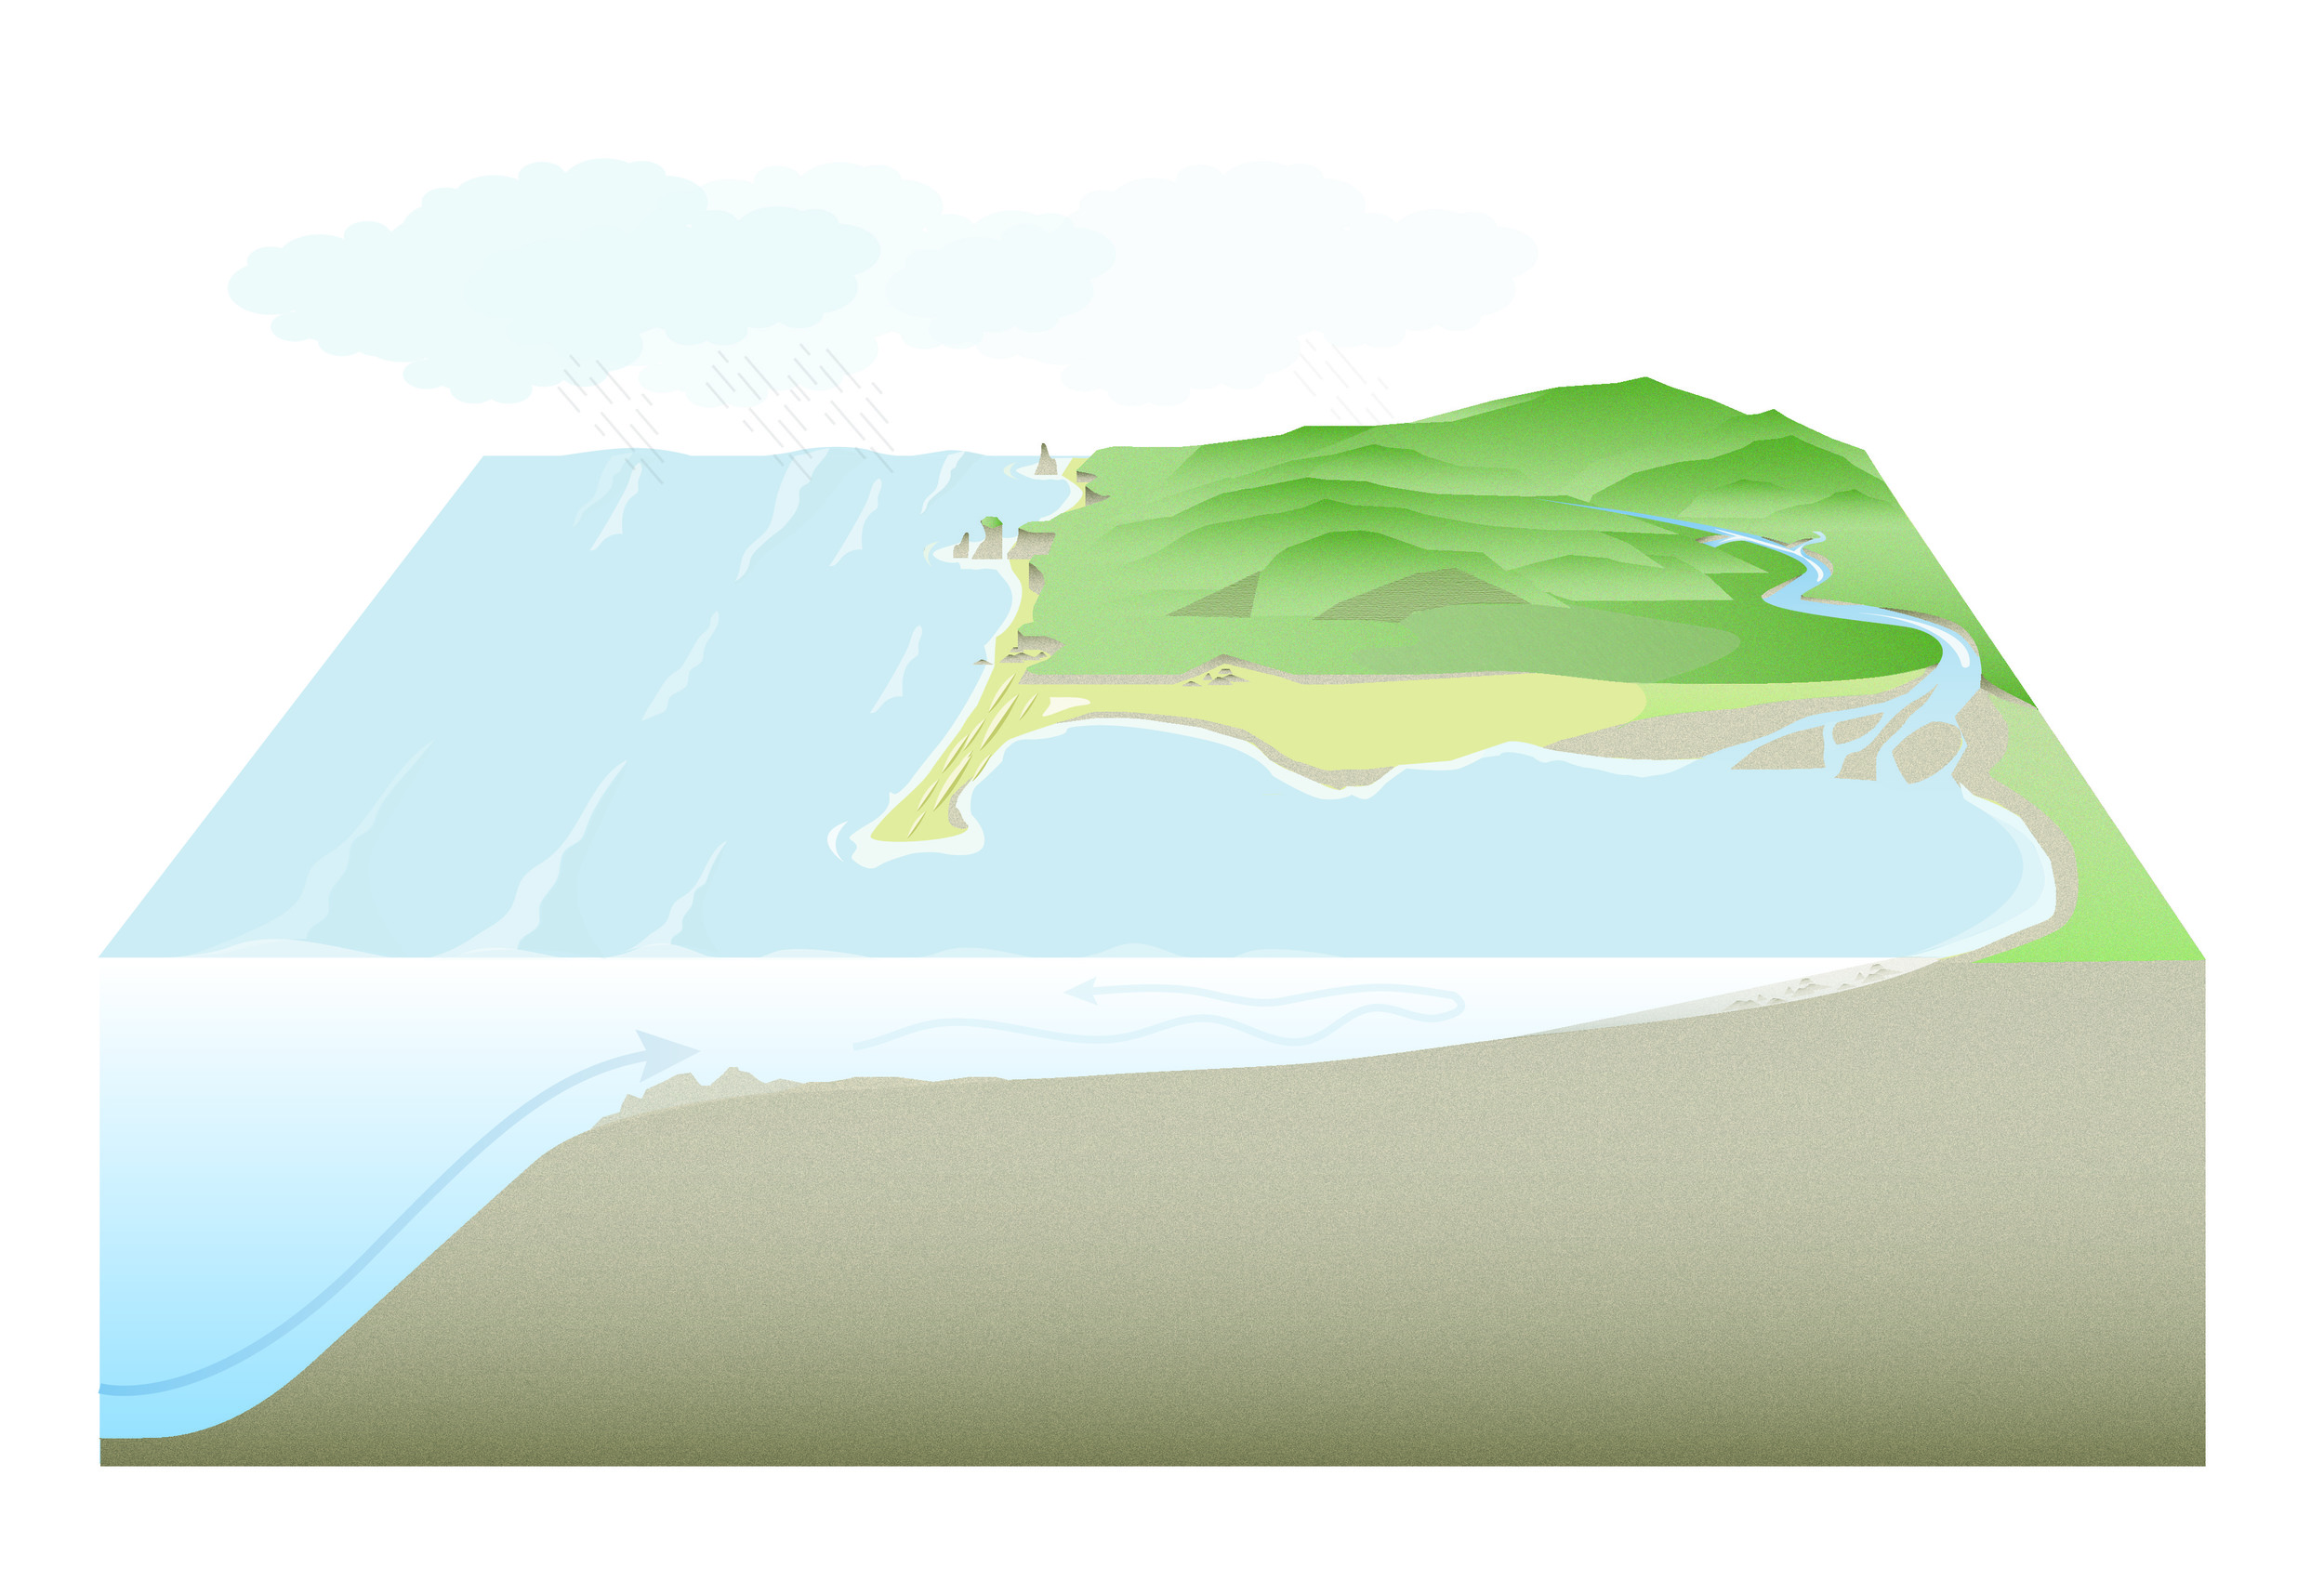
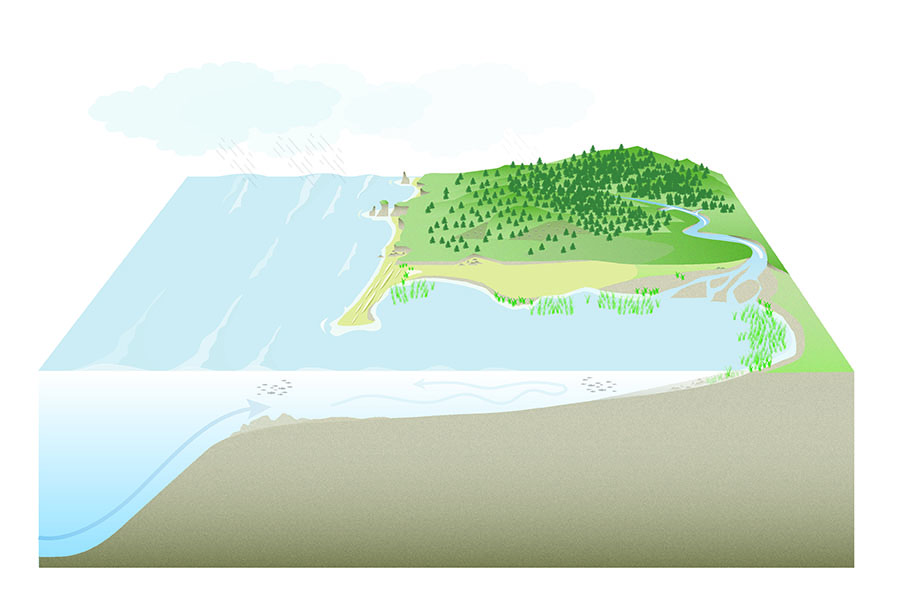
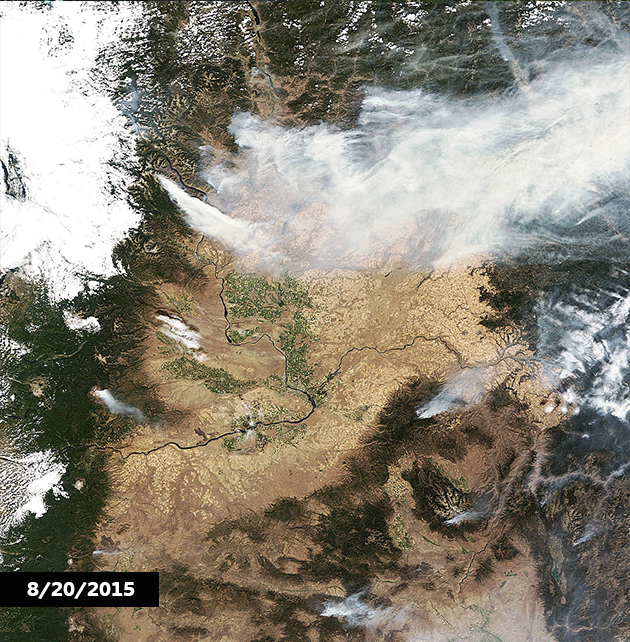
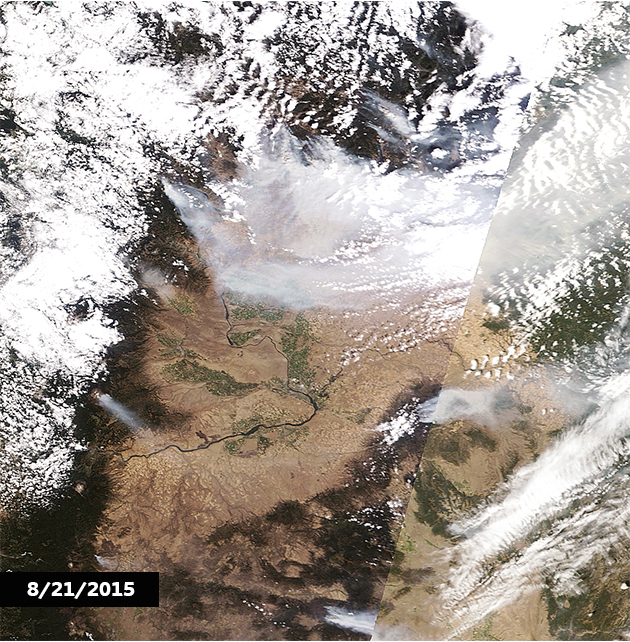
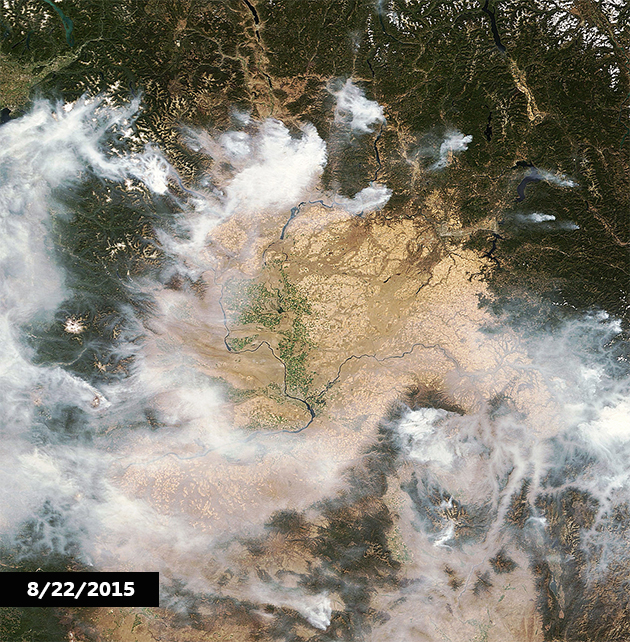
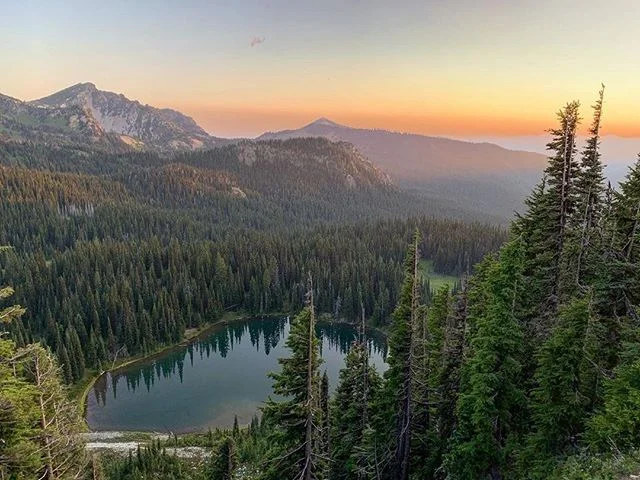
A (Jamie): An advantage to being a geographer at The Nature Conservancy is that we get to work on so many really cool projects!  I’m really excited about stormwater modeling, mapping fire severity throughout the Pacific Northwest, producing numbers to help finance a timber mill project, and modelling coastal vulnerability. And, there are many things I’m leaving out. It’s like winning an Oscar and having to thank everyone I work with on these projects!

Q: Who is your inspiration?

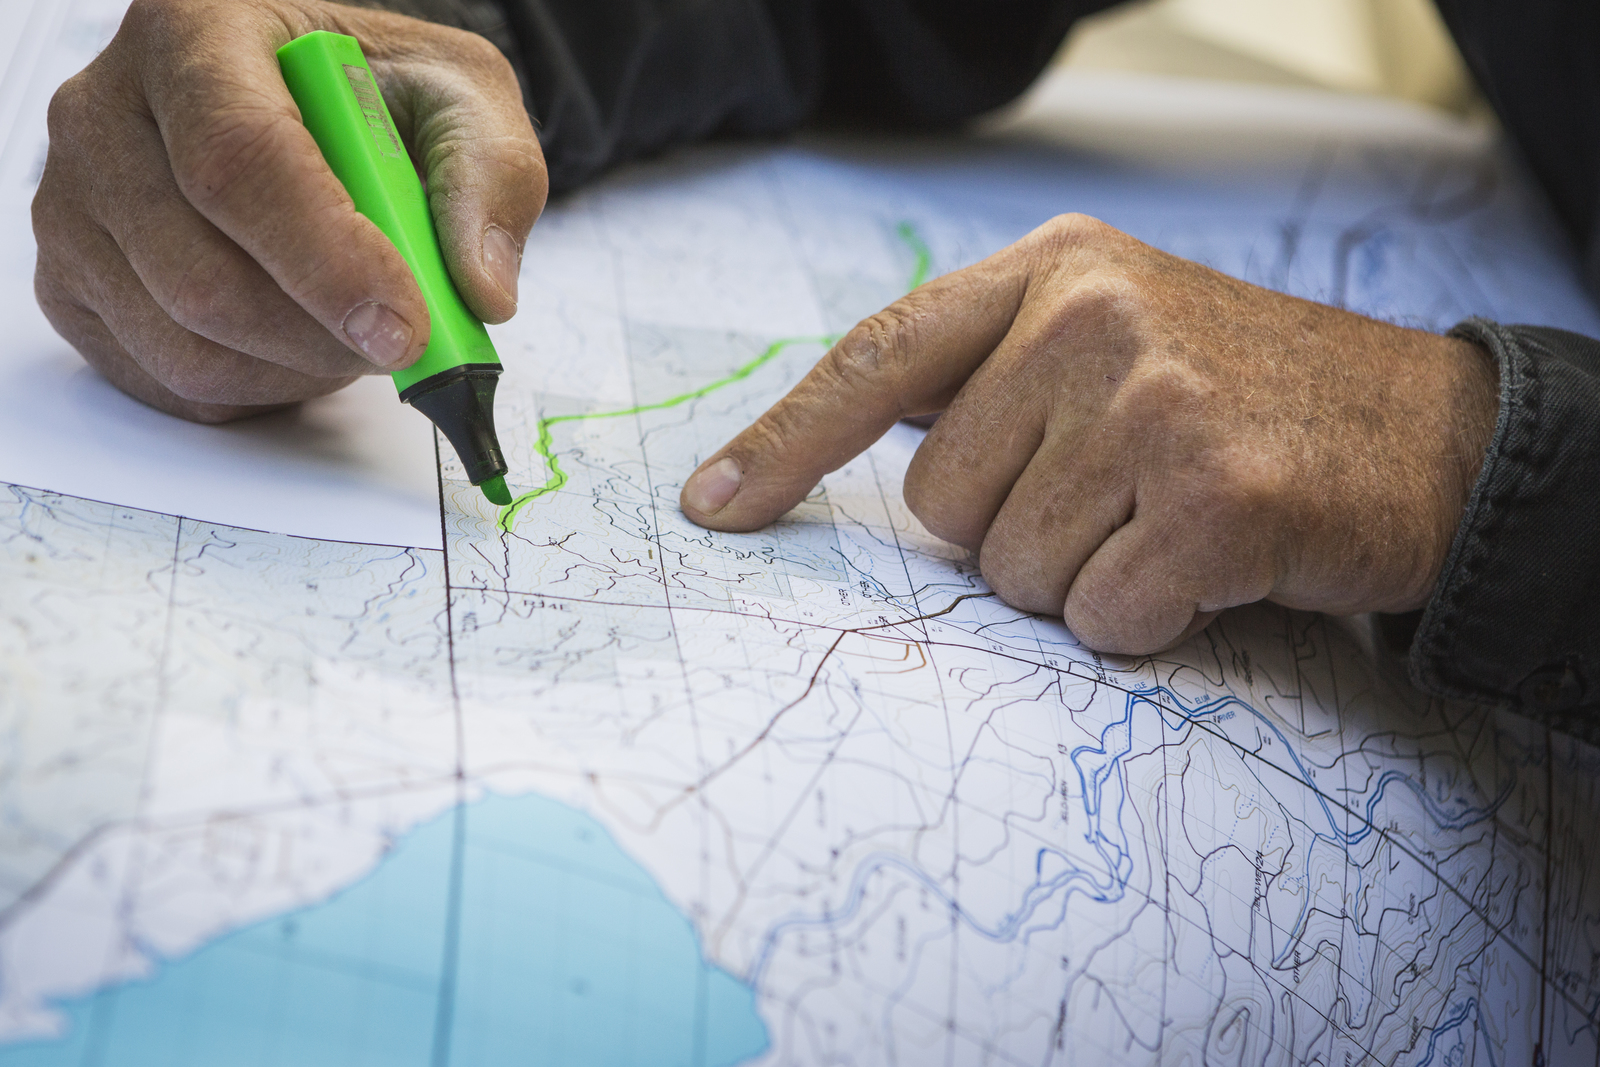
A (Erica): I am a big fan of many past and current cartographers who focus their craft on shaded relief. Shaded relief is a method for representing the peaks and valleys on maps in a natural, aesthetic, and intuitive manner. I also admire people who create infographics with their maps and people who map new and interesting topics.

Q: First mapping memory?

A (Jamie): In grad school, I was contracted by a land owner to map a forest being used for recreation and sustainable forestry in the Appalachian Mountains of North Carolina.  I actually got paid to hike the trails and collect coordinates of all the infrastructure and points of interest!  The deliverable was a poster size map, which (looking back) ended up being one of the ugliest maps I’ve ever seen.  

Q: What books would you recommend for the map enthusiast?

A (Erica): Maphead by Ken Jennings (non-fiction)

A (Jamie): The Mapmakers by John Noble Wilford (non-fiction/history).

Q: How many states/countries have you stepped foot in?

A (Erica): I’ve been to 23 states and 6 countries (Canada, Mexico, Chile, Argentina, Peru, and U.S.)

A (Jamie): All states except LA, MS, Al, AK, and HI.  I’ve stepped foot in Chile, Argentina, Peru, Bolivia, Ecuador, Spain, Sweden, Scotland/UK, Canada, South Africa, and China/Tibet, and the U.S., so 12 countries.

Q: What is one place you’ve mapped that you really want to go to!?

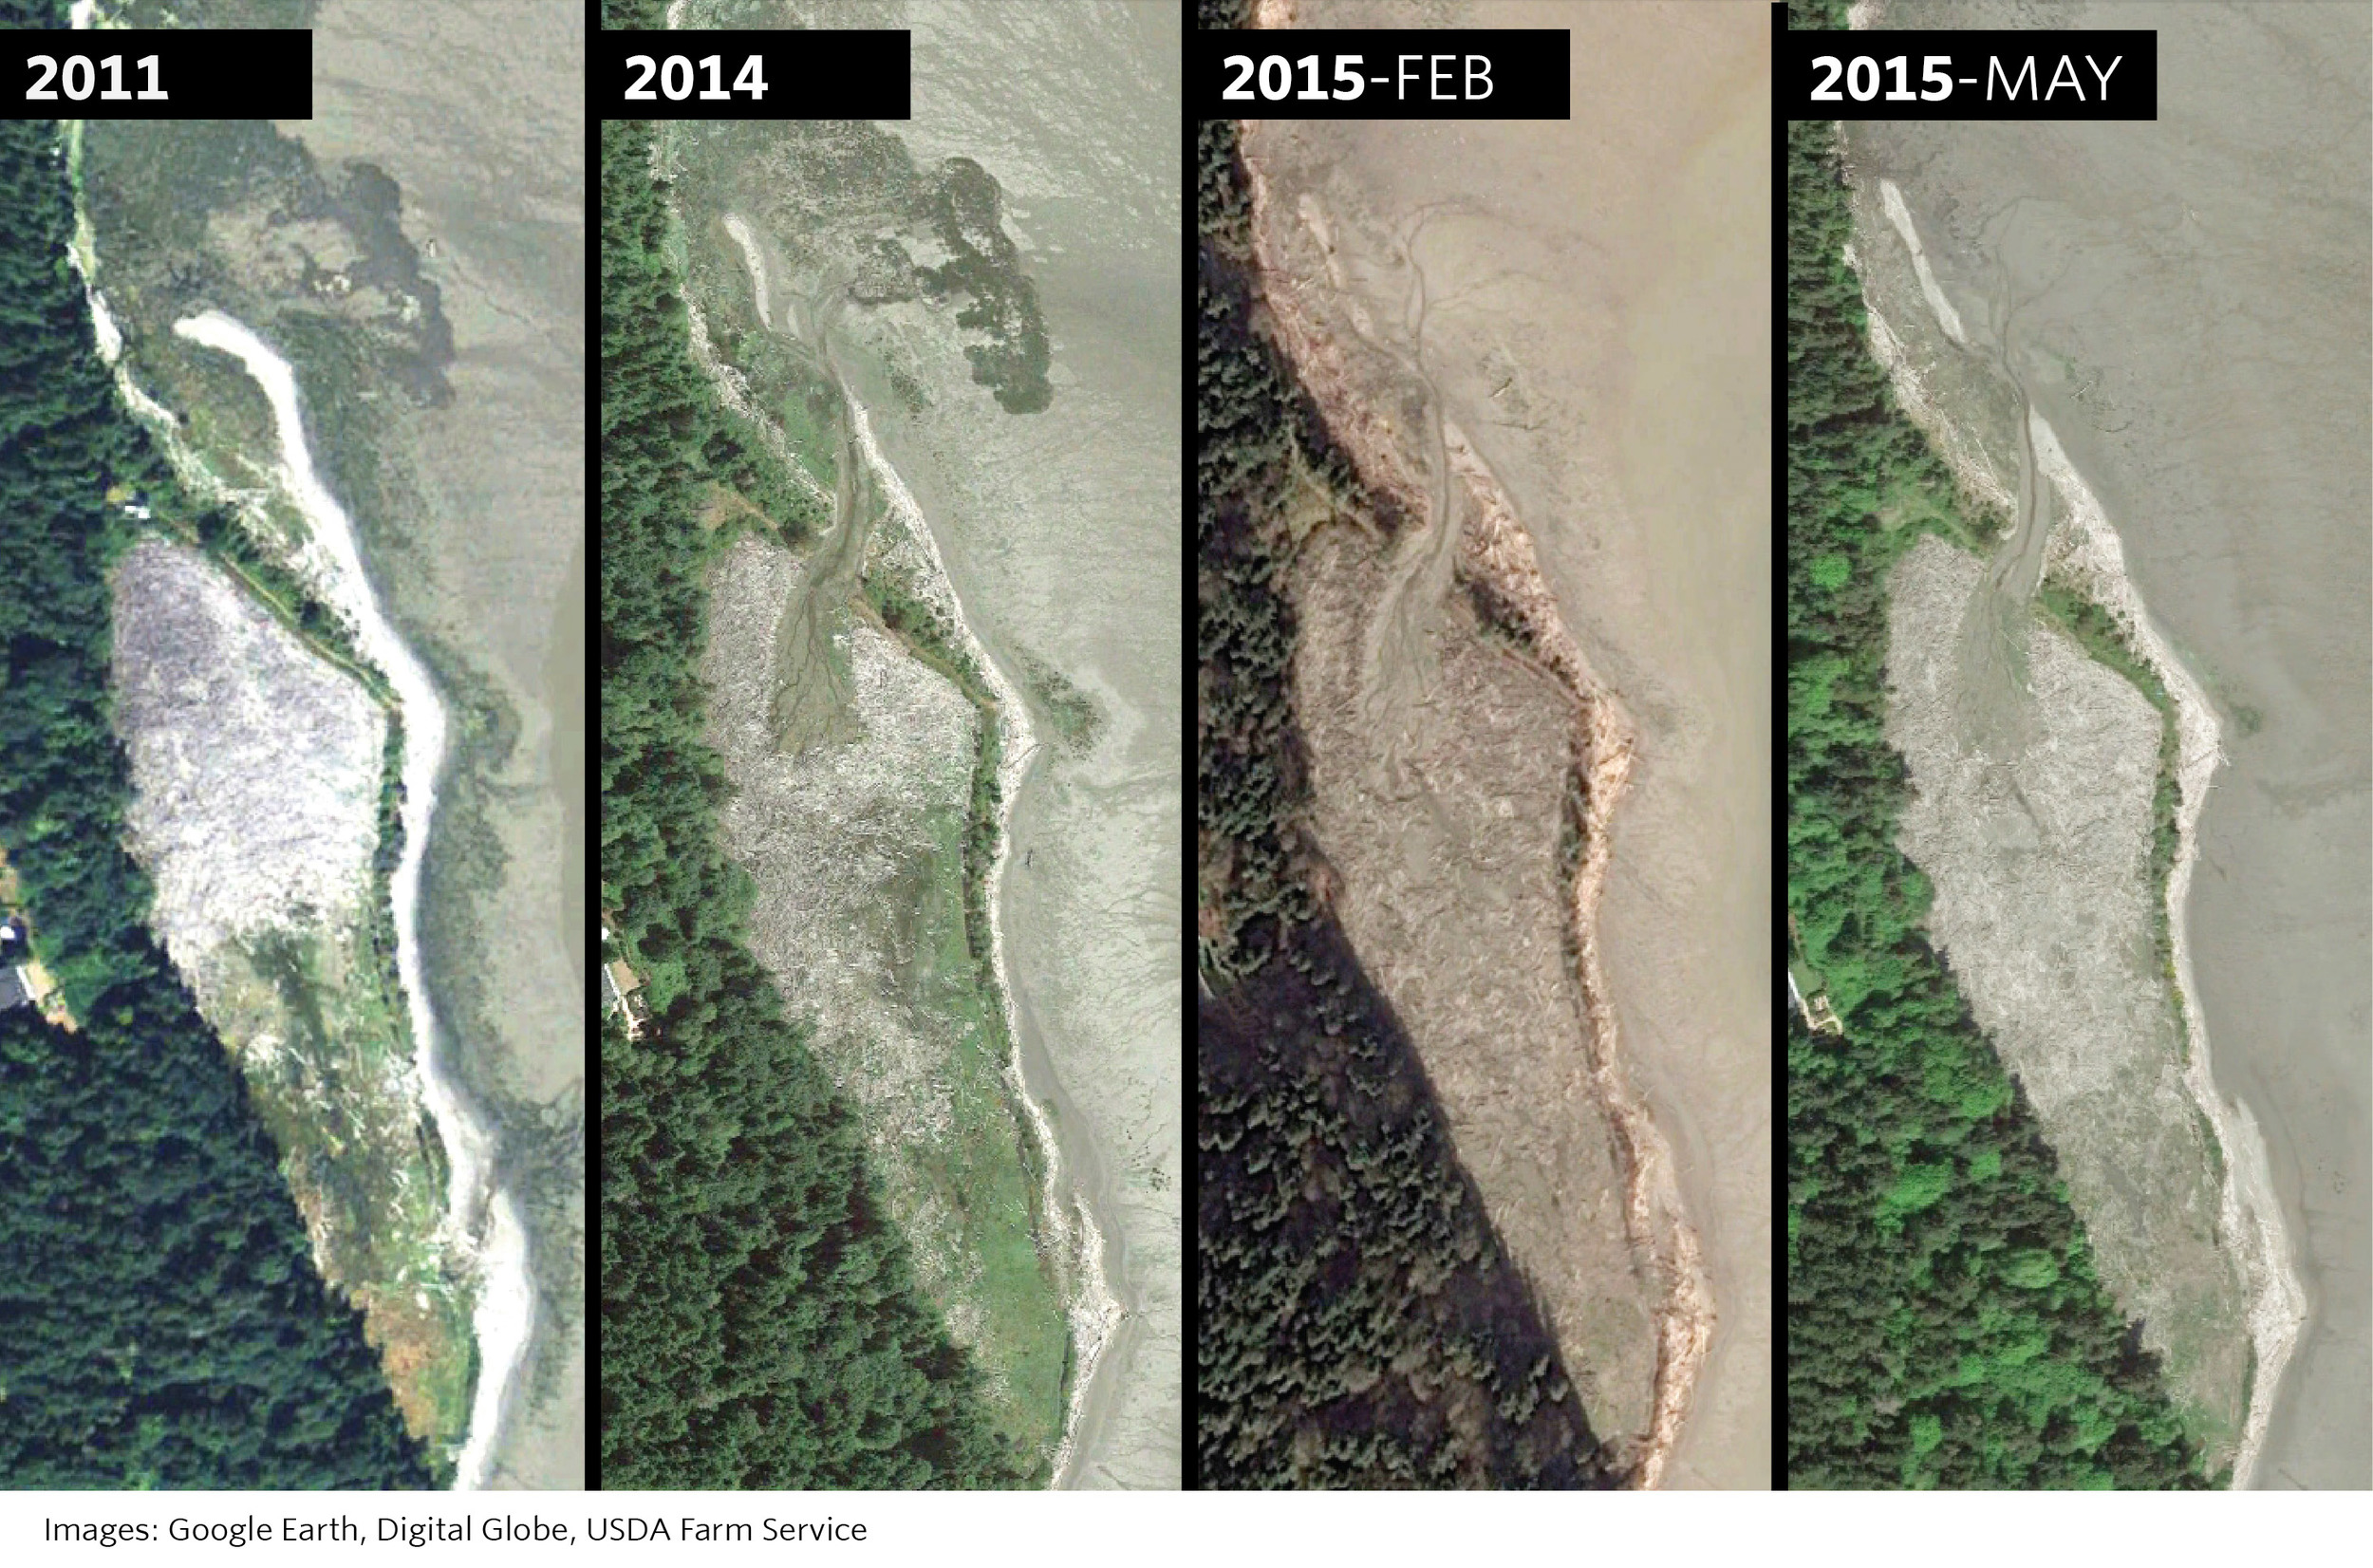
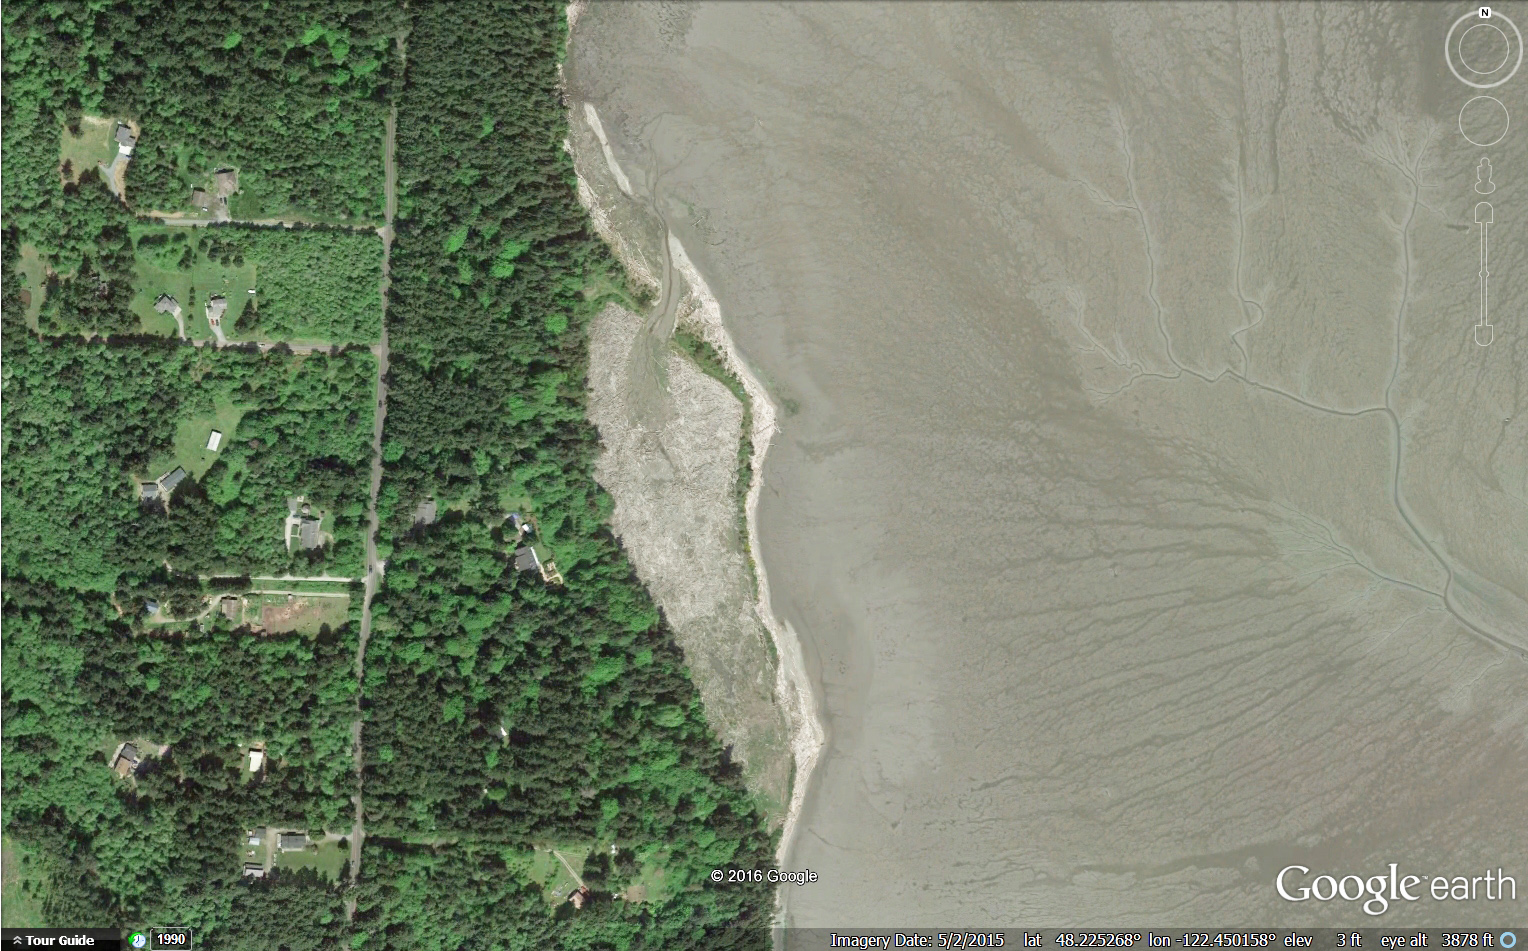
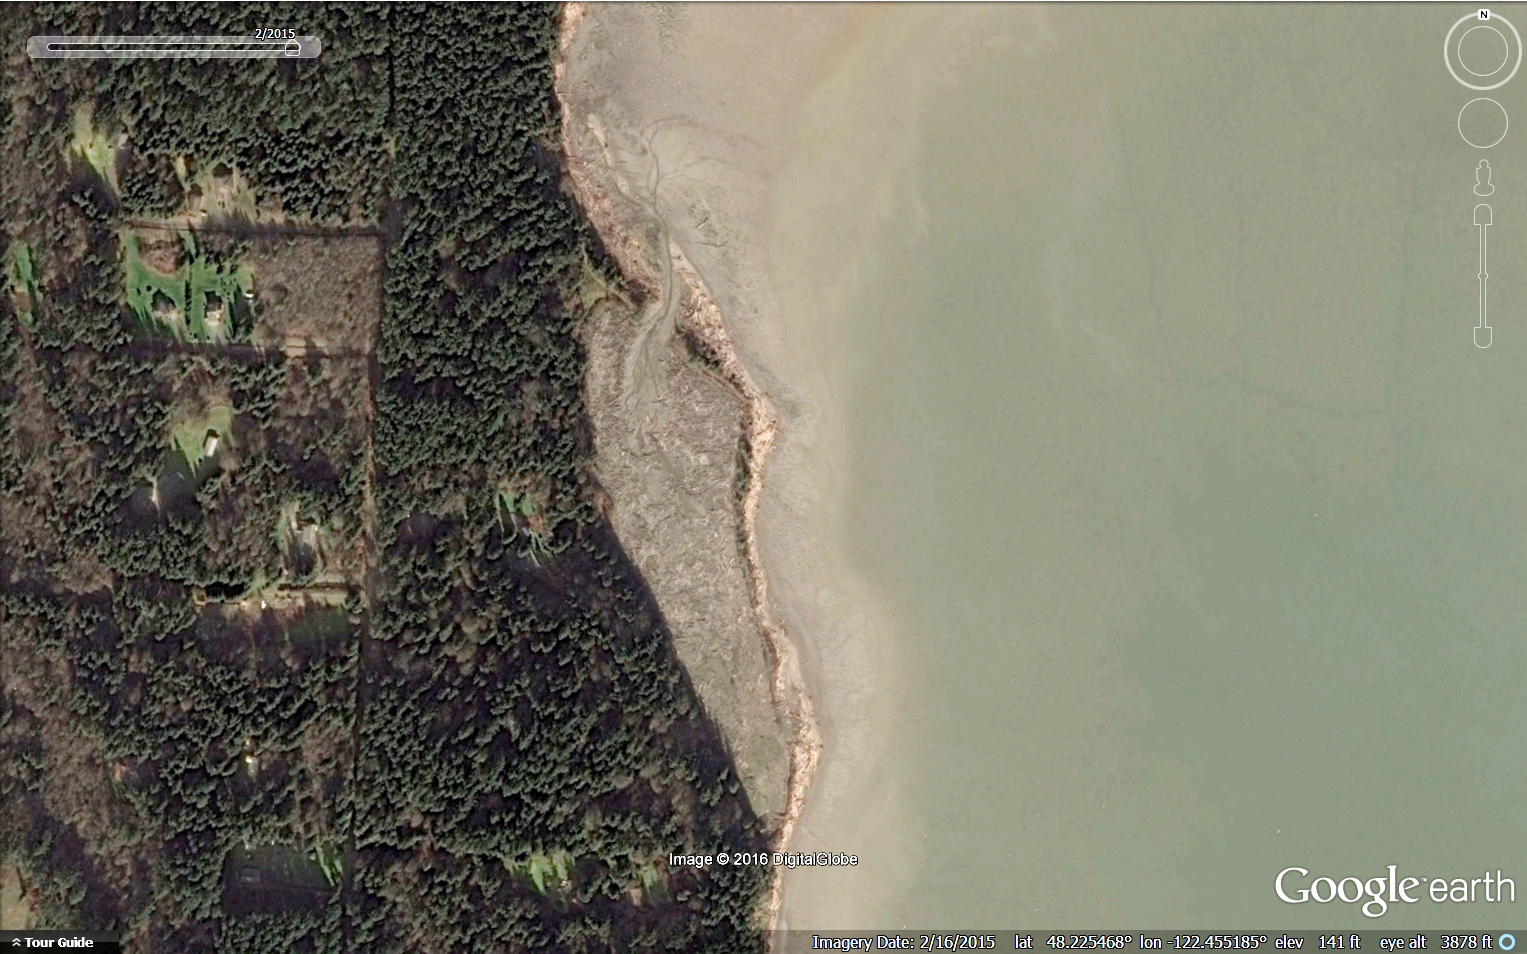
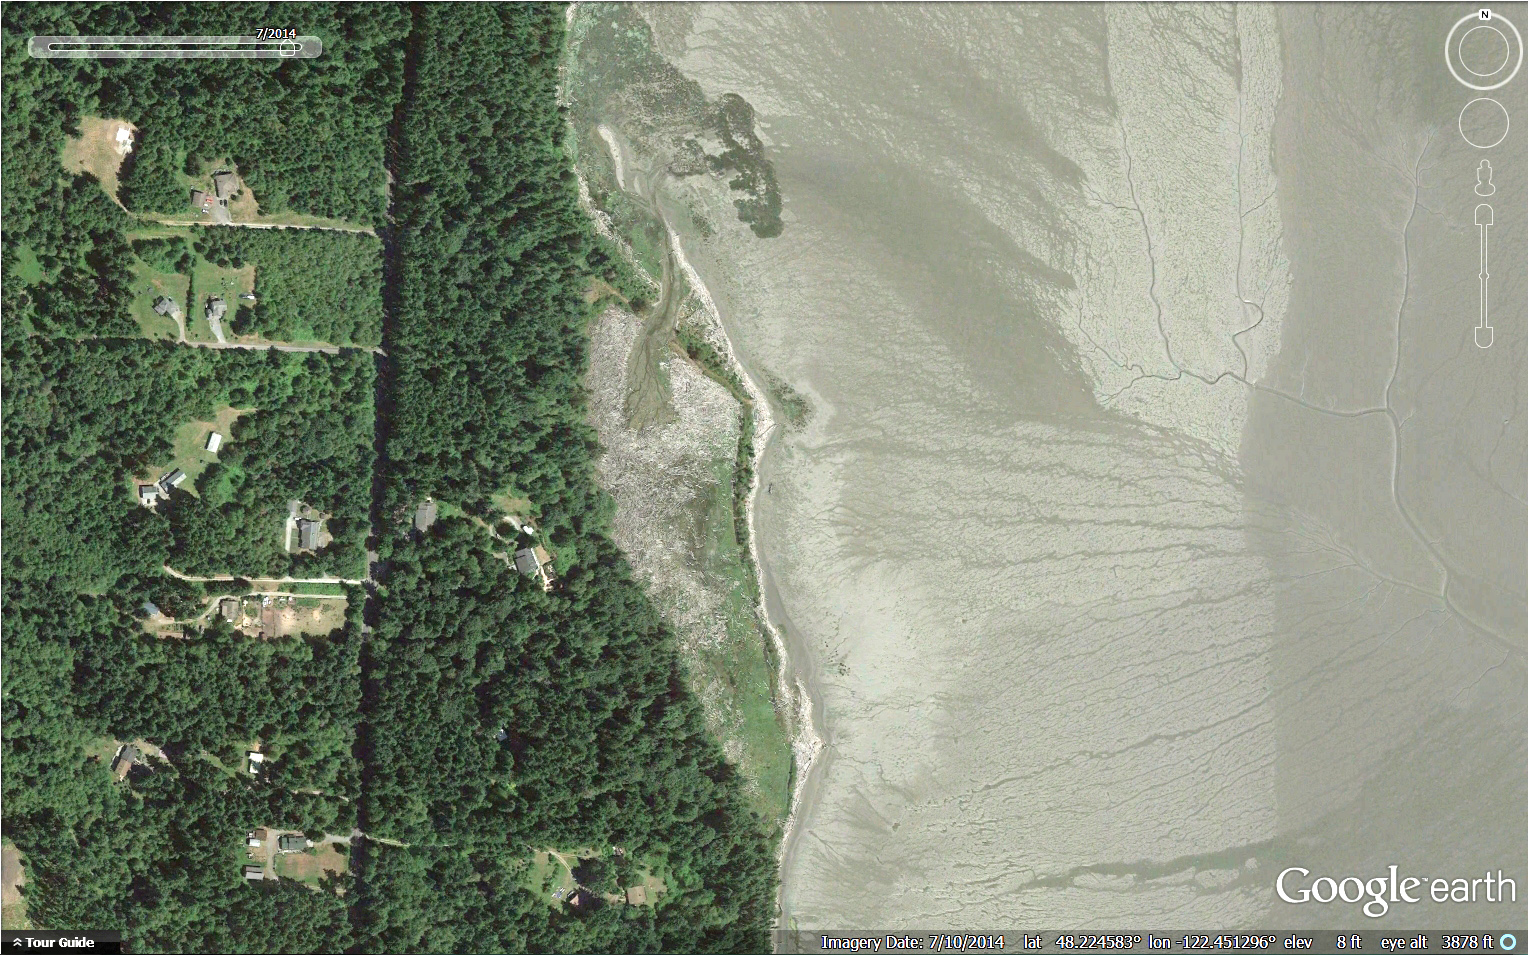
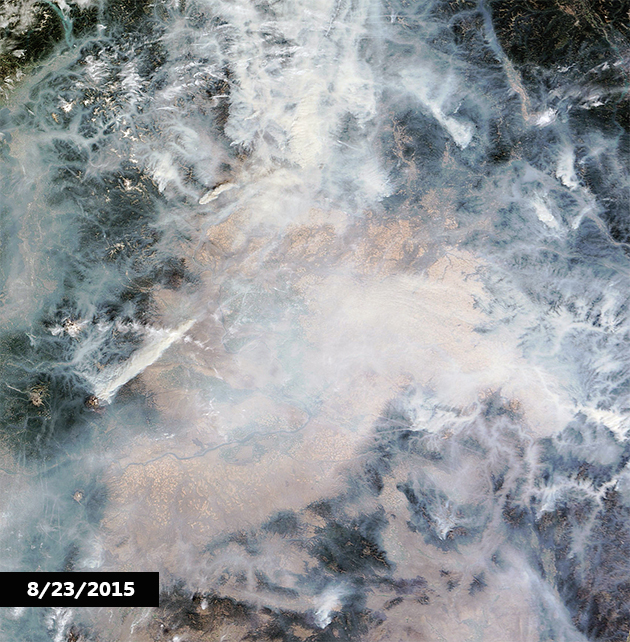
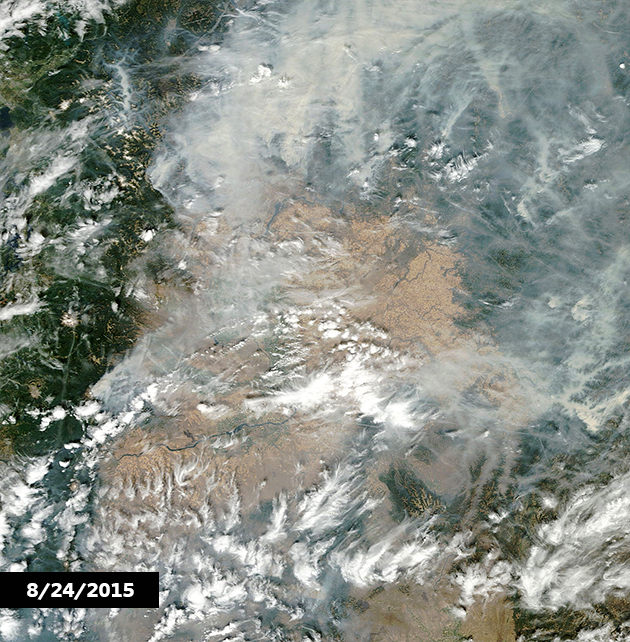
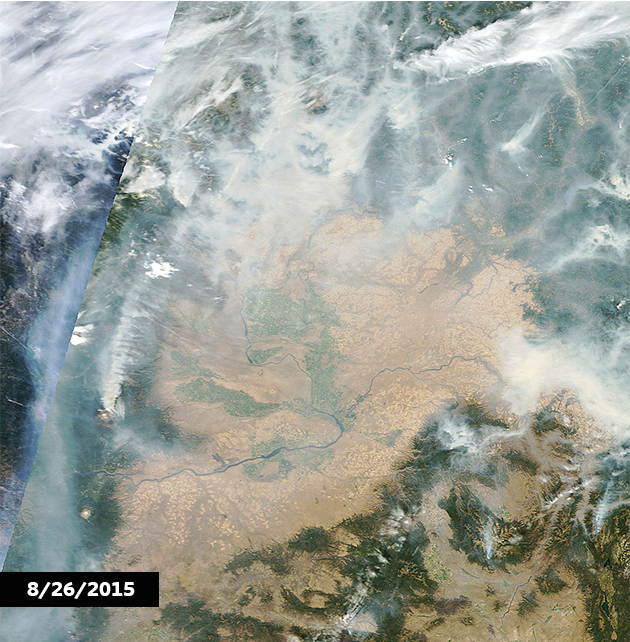
A (Jamie): Out of grad school I got a job as a GIS analyst with the National Zoo’s Conservation Research Center in Virginia. They do a lot of work in southeast Asia, and one of my big projects was mapping deforestation in Asian elephant habitat and ranges.  I was particularly fascinated by the Upper Brahmaputra River Valley but never had an opportunity to go.  The way the river braids and changes from year to year in the Assam area is incredible to witness via satellite imagery, but the upland forests neighboring Bhutan and Myanmar and the highlands leading towards China are what really appeal tome.  Maybe someday!

Q: What are you looking forward to as a GIS professional?

A (Jamie): One fundamental thing that a GIS professional can always look forward to is discovery. Although much of the world has been mapped and the entire world is being touched in some way by humans, our senses of place and our understanding of relationships among people and nature provide an infinite world of exploration.  Sounds cheesy, but I genuinely feel this way about my work.

Q: What is the power of maps?

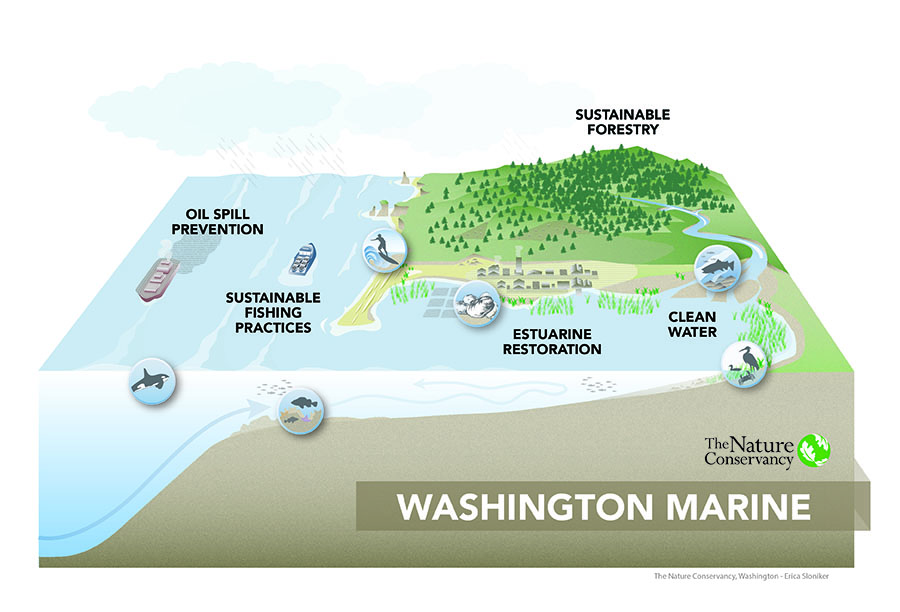
A (Erica): Maps and spatial analysis are amazing tools at understanding our world. Not only do they communicate, explain, and reveal information, but most of us remember more through visual learning! The Nature Conservancy uses maps and spatial analysis in just about every conservation project we work on. They are powerful in answering the most pressing environmental questions of the day, which lead to positive conservation impact for both people and nature.

Explore our Maps and Infographics 


Livingston Bay: Remodeled by Nature

Written by Joelene Boyd Puget Sound Stewardship Coordinator /Interim Stewardship Director
Maps by Erica Simek Sloniker, GIS & Visual Communications

Three years later the change is remarkable! Wood has moved out of the pocket estuary, the channel network is expanding and a natural sand spit is forming.

In 2012 The Nature Conservancy set work to restore a 10 acre pocket estuary in Livingston Bay. In order to do this we hired contractors to repair the breach at the southern end of the pocket estuary, breach the dike on the north end and excavate a “starter” channel so that tidal exchange would return. The desire was for wood to be carried out of the site by wind and tides and a channel would grow. The major goals of the project were to restore tidal influence to the pocket estuary, improve access for juvenile salmonids and other fish and restore salt marsh habitat.

From aerial images we see that this is exactly what’s happened - wood is moving out of the site through this starter channel allowing a network of channels and salmon habitat to develop. Additionally the natural sand spit is continuing to extend. It is impressive to see nature’s forces working to restore this pocket estuary with a little helping hand.

A pocket estuary is a type of nearshore habitat that is used to describe an estuary that is protected from waves, wind and other forces. Pocket estuaries in Puget Sound provide critical rearing habitat for juvenile Chinook salmon and other fishes that depend on these partially enclosed estuaries to eat, grow and seek refuge from predators. Researchers estimate that in the Whidbey Basin approximately 80% of the pocket estuaries have been lost.

Historically the Livingston Bay pocket estuary had been diked in the early 20th century to allow for grazing. However, sometime in the 1980s a storm had breached the southern end of the dike causing the area to fill up with wood from strong winter windstorms and high tides. After purchasing the property the Conservancy set to work on designing and carrying out a restoration project to restore the daily tides and function of the pocket estuary necessary to provide juvenile Chinook habitat which was identified as a limiting factor for Chinook salmon survival (Beamer 2003). 

Learn More About Our Work in Puget Sound

Maps are our DNA

Maps by Erica Simek Sloniker, GIS & Visual Communications
Written by Julie Morse, Regional Ecologist

Here at The Nature Conservancy, we love maps.  So much so, that one of the best features of our new office is a big beautiful conference table made of reclaimed 100 year old fir timbers and recycled steel beams from the building.  And welded into the steel beams table legs are perfect cubby holes, just for maps.   While admittedly we don’t use big paper maps like we used to, they still seem to be infused in our culture and even made their way into the design of our new office.

Maps help us tell a story.  They help us see the story.  They guide us to the story.  Maps help us interpret the story.  

These new climate maps illustrate just how powerful maps can be in helping us tell a story about how climate change will impact Puget Sound.  While we know climate change will affect all of us, these maps help us get smarter and sharper about where and when impacts will be the greatest.   They help us plan accordingly and make smarter decisions.

Unfortunately, these maps don’t give us a crystal ball into the future.  They can’t tell us exactly where abig flood in 10 years will be, and how deep the waters will get.  They don’t tell us how many salmon will survive warmer waters and lower flows during a summer drought 30 years from now.   But they do help inform our conversations with agencies, in for example, moving towards better regulations that addresssea level rise.  They do catalyze conversations with local communities who are grappling with the magnitude of change in water availability or increasing flood risk.  

These maps are our bread and butter.  Conversation starters. And insights into stories of our future.  

LEARN HOW WE'RE TACKLING CLIMATE CHANGE ISSUES IN WASHINGTON

Global Forest Maps Give Local Insights

Written by Erica Simek Sloniker (GIS & Visual Communications) & Ryan Haugo (Senior Forest Ecologist)

Data showing global forest change is providing a glimpse into local stories about Pacific Northwest forests. The University of Maryland, Google and other partners are using satellite data to analyze all types of forest loss, including harvest, fire and tree deaths due to insect outbreaks, in addition to also tracking forest gain. The Landsat satellite system that captures this data is capable of delivering global coverage every 8 days, giving incredible insight into how forest change is monitored globally and locally.  Data was collected between 2000 and 2013. Scroll below to see four local case studies.

CENTRAL CASCADES: Forest gain is shown in blue from regrowth of trees following Plum Creek Timber harvests in the Central Cascades south of Cle Elum. Forest loss is shown in red north of Cle Elum in the Teanaway from harvesting & fire prior to protection from the creation of the Teanaway Community Forests in 2013.

OLYMPIC PENINSULA: Harvesting and regrowth on the Olympic Peninsula near Forks.

OKANOGAN: Striking swaths of red in north central Washington show forest loss as a result of the 2006 Tripod Complex wildfire, which burned over 175,000 acres. The Tripod Complex wildfire is now sandwiched between the 2014 Carlton Complex and the 2015 Okanogan complex fires, which burned over 500,000 combined acres.

BRITISH COLUMBIA: Forest loss in red is likely from pine beetle outbreaks in British Columbia.

Data Sources: InciWeb, FAMWEB, “Okanogan Complex Wildfire now Biggest in State History” Seattle Times – August 25, 2015

Our Role from Land to Sea - and How I Make it Look Good

Written and Created by Erica Simek Sloniker, GIS & Visual Communications Specialist

How many times have you heard the saying “a picture is worth a thousand words”?

Scientific research can back this up and has shown that humans process visual information much more rapidly than pure text. It is no surprise then that infographics that combine art with science are helping present data and scientific concepts in memorable and easy to understand ways.

I make maps and illustrations for The Nature Conservancy. Let me introduce you to my most recent creation, an illustration about The Nature Conservancy’s marine conservation goals. In this slideshow, I will take you step-by-step through the artistic and conceptual decisions made in its creation in order to leave you with a better understanding of the drivers behind our marine conservation program.

Find out how this infographic was made in the interactive slideshow above!

Support Our Work

Wildfire Smoke from Space

Graphics by Erica Simek Sloniker, Conservation Information Manager

These Washington wildfires are now the largest in state’s history. Check out these NASA - National Aeronautics and Space Administration maps that capture the past week in smoke from space in the slideshow above, then explore Washington State University’s smoke projection mapping tool!